Factored Form
Another quadratic equation is factored form. The equation is written as: y= a (x-r) (x-s)
The reason it’s known as factored form is because the equation has been factored to get the zeros (x intercepts). The factored form equation is the easiest to graph because the zeros are almost given to you.
How to graph a factored form equation
1. Find the zeros/x intercepts
In order to find the zeros of a parabola you have to set the brackets to equal 0. Then isolate for x by moving everything else to the other side to find the R and S values. This will give you the x intercepts and those are your first points on your graph.


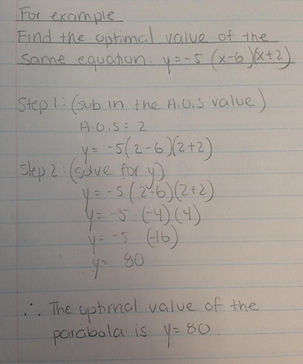
The last thing you have to find to finish graphing your parabola is the optimal value. All you have to do to find the optimal value is sub in the axis of symmetry value as x, into the original equation and solve for y.
Earlier we learned that the axis of symmetry is the midpoint of the parabola. Therefore it is the center of the zeros. So, the axis of symmetry can be found by simply adding the zeros and dividing them by 2 (finding the average).
2.Finding the axis of symmetry (A.O.S)
3. Find the optimal value


The axis of symmetry will help you find the optimal value
The x intercepts will help you find the axis of symmetry
How does Factored Form connect to graphing?
Graphing factored form is very simple. Once you set the brackets to zero you receive the x intercepts. Using the x intercepts you can find the axis of symmetry and the optimal value and graph the vertex. All you have to do is connect the vertex point and the x intercepts together to get your parabola.